
When you load a WordPress website, a lot of things happen in the background. For one, the platform sends a lot of queries to your database to get specific pieces of information. The problem is, WordPress doesn’t offer you a simple way to keep track of what these queries are or how to monitor them.
That’s where a plugin like Query Monitor comes in. With this tool, you can monitor all of the queries made to your database, which helps you keep an eye on what resources you’re using. In this article, we’ll talk about what queries are and how it can benefit you to track them. We’ll also teach you how to use the Query Monitor plugin and interpret its results.
Let’s get to work!
What WordPress Queries Are (And Why You Should Monitor Them)
In the simplest terms, a ‘query’ is a request made to a database to return information. When WordPress (or any of your plugins or themes) requests information from your database, they do so in the form of a query.
When someone loads your website, several queries fire off in the background. Monitoring what these queries are can enable you to:
- See which plugins or themes have a larger impact on your performance. Each query takes time and the more requests a specific tool makes, the more impact it will have on your site’s performance.
- Monitor what resources you’re using. Some query monitoring tools enable you to see how much memory you’re using and how much of your content is cached successfully.
- Improve your troubleshooting. If you know how to monitor your queries, you can troubleshoot a lot of issues more efficiently. For example, if a plugin isn’t working correctly, it can often be due to a query not firing off properly.
In most cases, you’ll use query monitoring to improve your website’s performance. By figuring out which plugins or themes are using the most resources, you can take steps to optimize these bottlenecks. For example, you could replace the resource-heavy tools with better-optimized alternatives, or upgrade your hosting plan.
An Introduction to the Query Monitor Plugin

The Query Monitor plugin is a sophisticated tool that can do a lot more than help you monitor queries. It also enables you to keep an eye on AJAX calls, REST API requests, and even redirects.
The plugin enables you to identify exactly what components are making each request, how long it takes to process, and more. It will also notify you right away about any outright slow queries, duplicate requests, or any errors it runs into. This can be helpful for both troubleshooting and development purposes.
This all makes Query Monitor an incredibly useful plugin. The problem is, it can be hard to make head or tail of its output unless you have a background in WordPress development. We’ll talk more about how to interpret your Query Monitor logs in the next section – particularly as it pertains to performance – so keep reading.
Key Features:
- Monitor your database queries, AJAX calls, REST API requests, and redirects.
- Identify which WordPress components make each request.
- Check out how long each request takes to process and what information it pulls.
- Receive notifications concerning slow requests, duplicate queries, and other types of errors.
Price: FREE | More Information
How to Monitor Your WordPress Queries
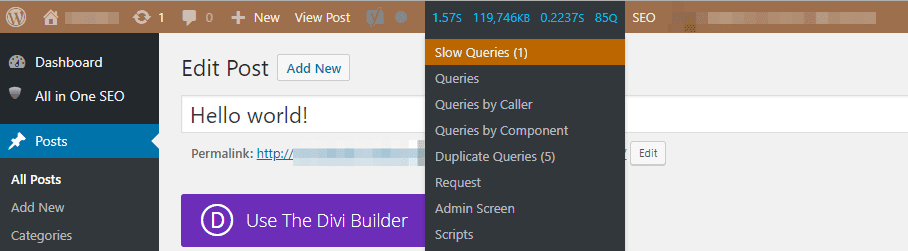
The first step of the process is to install the Query Monitor plugin. Once the plugin is active, you’ll notice a new addition to your admin bar:
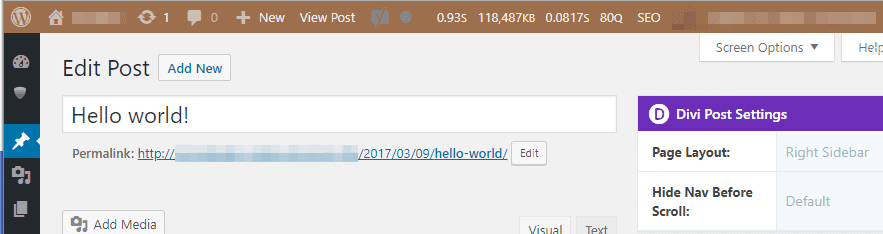
In order, this new section enables you to monitor the page generation time, peak memory use, the database query time, and the total number of queries. If you click on the section, a new menu will appear, including a multitude of options. Selecting any of these will take you to your query report:
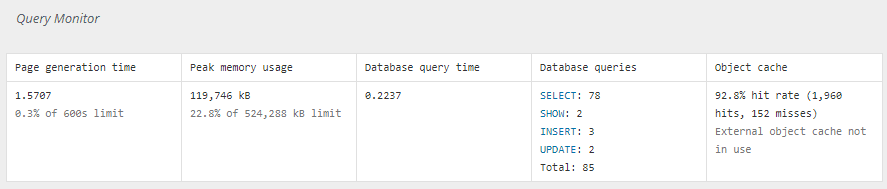
Your query report is broken into individual sections, which you can jump to using the menu in your admin bar. In this example, you can see the plugin doesn’t detect any issues except a few duplicate items:
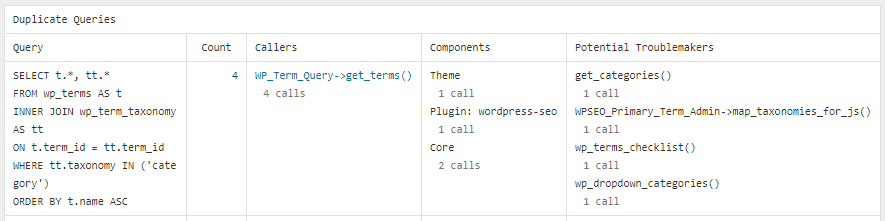
If we dig deeper into the Duplicated Queries section, we can take a look at the offending queries. Some duplicates, like the examples above, are harmless and won’t affect your website in any way. However, checking out this section can be smart if one of your plugins isn’t working as intended since it can enable you to pinpoint compatibility issues.
You’ll probably spend most of your time within your query report checking out the Queries by Component section. Here you can check out how many queries each of your plugins and themes makes:
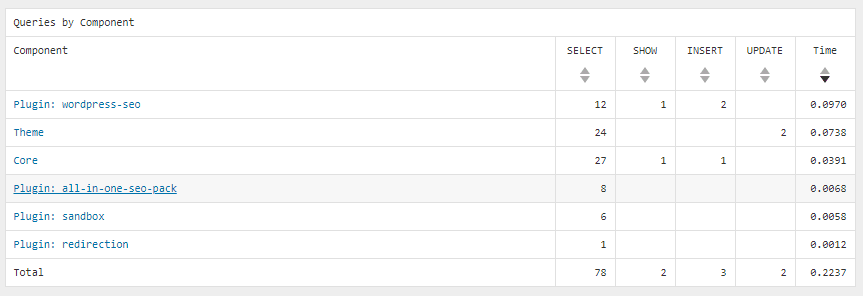
You’ll notice the active theme here is Divi, and that it sometimes makes a lot of requests. The number of queries you see can vary from one report to another, so there’s no reason to panic. Here’s another report also showing Divi, a couple of minutes later:
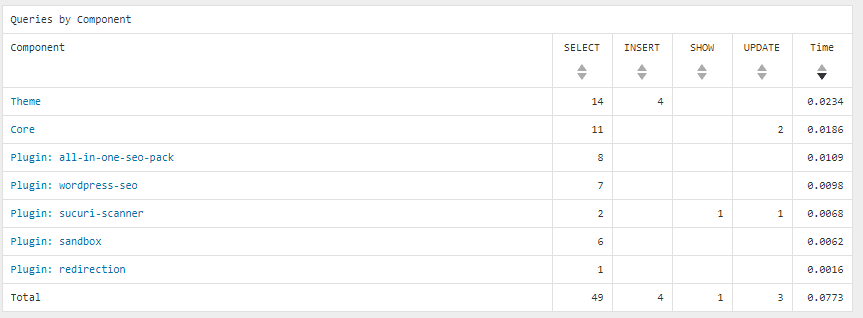
Aside from the number of queries each component makes, the most important metric here is Time. The higher the value under the Time column, the more a plugin or a theme can impact your website’s performance. For example, look at Yoast SEO, which appears as wordpress-seo. We previously tested some plugins to measure their impact on your website’s performance, and we found that Yoast SEO required a lot of resources. When you take a look at the number of requests the plugin makes here, those results make sense.
In any case, if your website runs into performance issues, this table provides you with a quick way to gauge if any of your WordPress components are behind the problem. Keep in mind, though – there can be a lot of causes for lackluster website performance so plugins may not necessarily be the culprits.
If you scroll back up, you can see a full breakdown of each query. For each row, you’ll find information on what performed the query, which values it pulled, and how long it took:
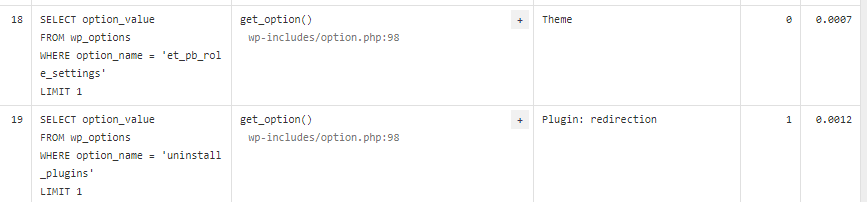
In most cases, you won’t need to read through individual queries to find the information you need. In fact, we’ve already covered the most important part of your query reports, which are duplicate items and the components table.
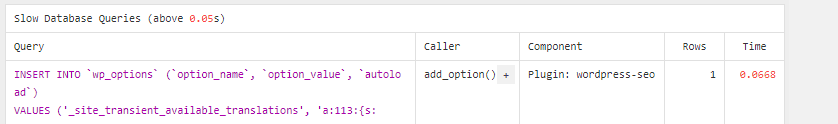
All that’s left for you to look out for are individual notifications. As we mentioned earlier, sometimes the Query Monitor will notify you when it runs into slow queries, such as in this example:
If you click on the notification, you’ll see a new report, with the offending query right at the top. In this case, the culprit was Yoast SEO, and it happened when we loaded the WordPress editor:
Just to be clear – our test environment didn’t slow down much during this process. However, Query Monitor enabled us to figure out when things weren’t working out as well as they should, which is always valuable information. By keeping track of how different areas of your site performs, you can quickly address issues and optimize aspects that are hogging your resources.
Conclusion
Every WordPress website has its own database, which means it also has to process queries. The more complex your site is, the more queries it’ll need to handle. Keeping an eye on those queries is an excellent way to troubleshoot issues and figure out what your plugins and themes are doing in the background.
In most cases, you’ll want to keep an eye out for duplicate queries, to avoid compatibility issues. You can also break down the results of your reports by components. This enables you to monitor how many queries your plugins and themes make and when one of them takes longer than usual.
Do you have any questions about how to interpret WordPress queries? Let’s talk about them in the comments section below!
Article thumbnail image by magic pictures / shutterstock.com
The post What a WordPress Query Monitor Is (And Why You Might Need One) appeared first on Elegant Themes Blog.